2019 Air Quality on Track to Be Beijing’s Best in Six Consecutive Years
With four months in the bag for 2019, Beijing is showing a marked improvement on air quality once again, the sixth consecutive year that the air quality has been on the upswing (possibly more but we only have comparable data for the previous five).
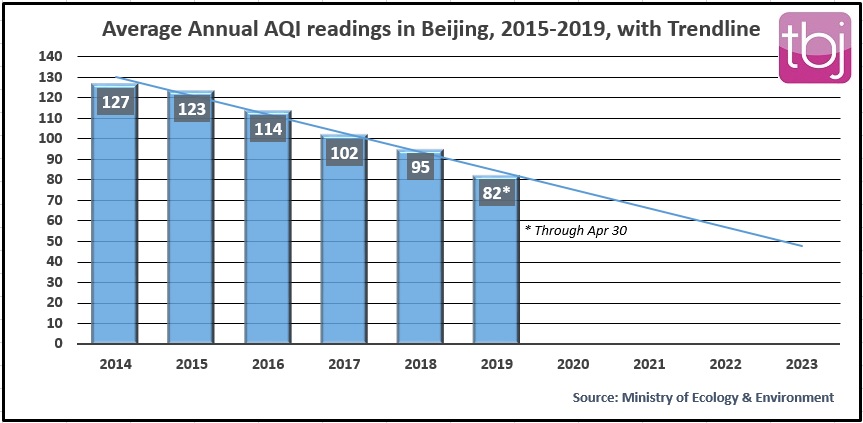
The average AQI in January through April of this year has been 82 – not fabulous by international standards but a decent improvement on last year’s measure of 97 for the same period.
If this holds up through the year, we are looking at beating 2018’s annual average AQI of 95 by more than 10 percent.
This follows the trend of improvement that the city has made annually every year since at least 2014, back then the city’s average AQI was 127. The next year saw an improvement of 3 percent to 123, then 2016 fell 8 percent to 114. In 2017 the AQI improved by 10 percent to 102, and last year it dropped 7 percent to 95.

Of course there are many ways of quantifying bad air – PM2.5 concentration, the total number of acceptable air days, or average AQI readings. I prefer to use the latter only because a) I am lazy and this data is readily available from the Ministry of Ecology and Environment and b) AQI is a catch-all rating for air quality that takes into consideration most of the important factors associated with bad air: particulate matter in both 2.5 micron and 10 micron sizes, as well as ozone, nitrogen dioxide, carbon monoxide, and sulphur dioxide.
A brief primer for the uninitiated: the number in an AQI scale does not represent the count of anything specific, it’s simply used as an easy-to-remember guideline percolated out of a wide array of data. We here in Beijing tend to obsess about PM2.5, however, you could have a day with virtually no PM2.5 floating around and still have a bad air day due to some other contaminant.
No matter how you slice it, the air’s improving. Sure, we have a ways to go before Beijing earns itself a reputation as an ecological paradise, but progress is progress, and the situation is looking damn better than what it used to, when days and months truly warranted the term airpocalpyse.
And if this trend continues, it is conceivable that the city could reach an annual average AQI of 50 – the upper threshold of what’s considered “good” air by the US Environmental Protection Administration – by 2023, a mere four years away:
How Does the AQI Work?
Think of the AQI as a yardstick that runs from 0 to 500. The higher the AQI value, the greater the level of air pollution and the greater the health concern. For example, an AQI value of 50 represents good air quality with little potential to affect public health, while an AQI value over 300 represents hazardous air quality.
An AQI value of 100 generally corresponds to the national air quality standard for the pollutant, which is the level EPA has set to protect public health. AQI values below 100 are generally thought of as satisfactory. When AQI values are above 100, air quality is considered to be unhealthy-at first for certain sensitive groups of people, then for everyone as AQI values get higher.
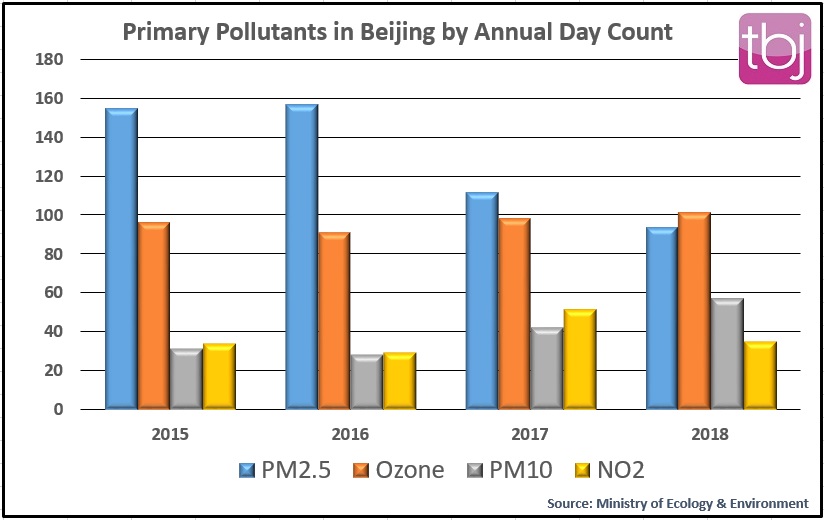
One caveat: China’s standards for good air in terms of PM2.5 concentration – which is the primary pollutant on 43 percent of all the polluted days recorded since January 2015 – are laxer than the US. A concentration of 35 micrograms per cubic meter would earn you an Excellent air rating in China (AQI 50), while an almost equal number would be closer to Moderate air quality (AQI 100) in the US. Interestingly, the standards for PM10 are actually slightly stricter in China versus the United States.

Now that we have more than four years of historical daily readings in the bag, we did some analysis just for kicks. Some of our findings:
- On average, Sunday is the worst day for air quality in Beijing, with readings 9 percent worse than the overall average. This could be due to the fact that there are no automotive restrictions on weekends (that or environmental inspectors are taking the day off). Tuesday was the best day, with readings 4 percent better than average.
- November is the worst month for air, with readings 16 percent worse than the overall average, followed by June (14 percent worse) and December (13 percent worse). The best months for air? September (23 percent better than average), followed by a three-way tie for second best (February, August, and October, all with air 12 percent better than average).
- It’s been over a year since the last time we had a truly airpocalyptic day (over AQI 300): the scale hit its peak of 500 on Mar 28, 2018. The worst days since then have been Apr 2, 2018 (AQI 272) and Nov 14, 2018 (AQI 270). The worst day so far in 2019 has been Jan 12‘s AQI of 267.
Hoping that house plants will help alleviate pollution in your home? Not so fast, buddy.
Images: ecosports.cn, Michael Wester/the Beijinger


