In dire need of an update: World Health Organization air pollution guidelines – Centre for Research on Energy and Clean Air
The current WHO air quality guidelines date back to 2005, after far more evidence on the health risk of air pollution has emerged. The organization recently released updated guidelines. Read CREA’s take on the update: energyandcleanair.org/who-2021-air-quality-guidelines/
This page provides an overview of why the guidelines need to be strengthened. CREA also brings you new tools to explore the current levels of air pollution around the world, compare it to current national standards and WHO guidelines, and look at the health impacts of air pollution and the health benefits of meeting better standards.
The WHO guidelines are often referred to as “safe levels”. This assumption makes sense — why would the World Health Organization recommend levels that are known to increase the risk of death or disease? However, the latest science shows the 2005 guideline levels are anything but safe, especially in the case of PM2.5 and NO2.
Key points:
- PM2.5 pollution well below the guideline levels is likely to increase the risk of death for COVID-19 patients — a new public health issue related to air pollution.
- Numerous studies in North America, Asia and Europe demonstrate severe health risks from PM2.5 and NO2 air pollution, even at levels far below the current WHO guidelines. This includes risk of death from chronic diseases and risk of childhood asthma.
The Latest Science
The 2005 guidelines for the annual average concentration of PM2.5 and NO2 are 10 µg/m3 and 40 µg/m3, respectively.
A new risk model for deaths related to PM2.5 built on the latest population studies shows the risk of death increasing sharply from a concentration of 2.4 µg/m3, one-quarter of the WHO guideline of 10 µg/m3. Another research paper identified 14 different studies done on PM2.5 mortality on populations with mean exposure levels below the WHO guideline, with “ample power” to demonstrate health risks below this level.
The gap between NO2 guidelines and current science is particularly yawning, as NO2 is almost as deadly as PM2.5, microgram-for-microgram, while the guideline is four times as high. For example, the WHO recommends a concentration-response function for PM2.5 based on a 6% increase in the risk of death from all causes for a 10 ug/m3 increase in average concentration levels, whereas studies show an around 4% increase from the same increase in NO2 concentrations, based on studies covering concentrations down to 1/10 of the WHO guideline level.
One tragic impact of NO2 pollution is its contribution to new cases of childhood asthma globally, with an estimated 4 million children affected every year. The authors estimate that the risk of asthma in children increases starting from a concentration of 4 µg/m3 (range: 0–10 µg/m3), again a tenth of the guideline level.
Meeting the guidelines — where do the pollutants come from?
Putting stronger guidelines and targets on paper is only the first step to avoiding the heavy toll of air pollution on our health. Emissions from the key polluting sector will have to be reduced sharply to achieve good air quality across the world.
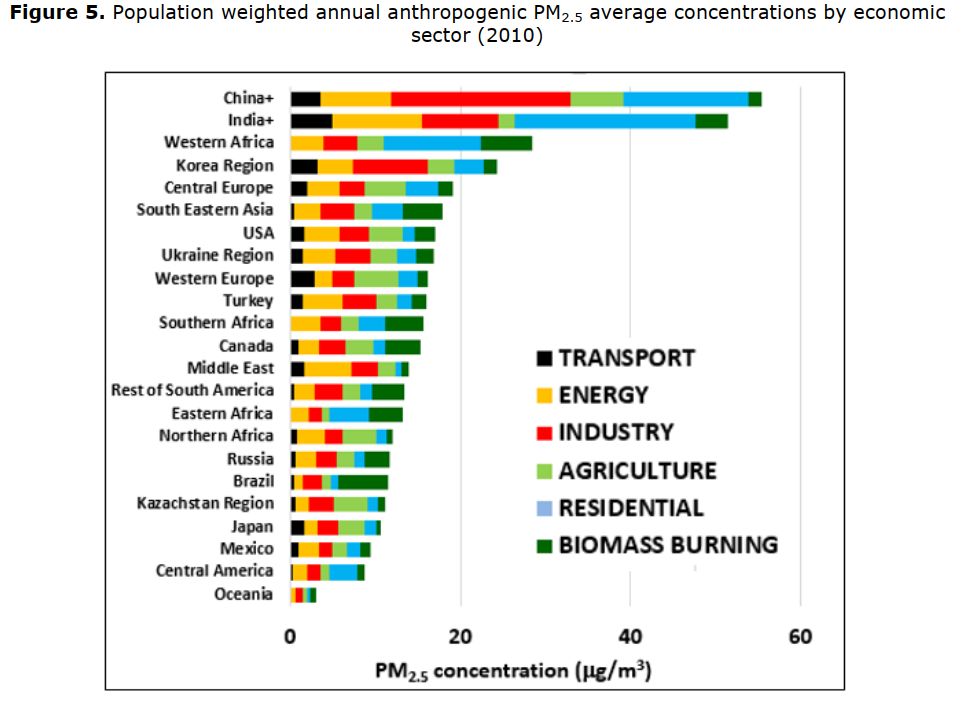
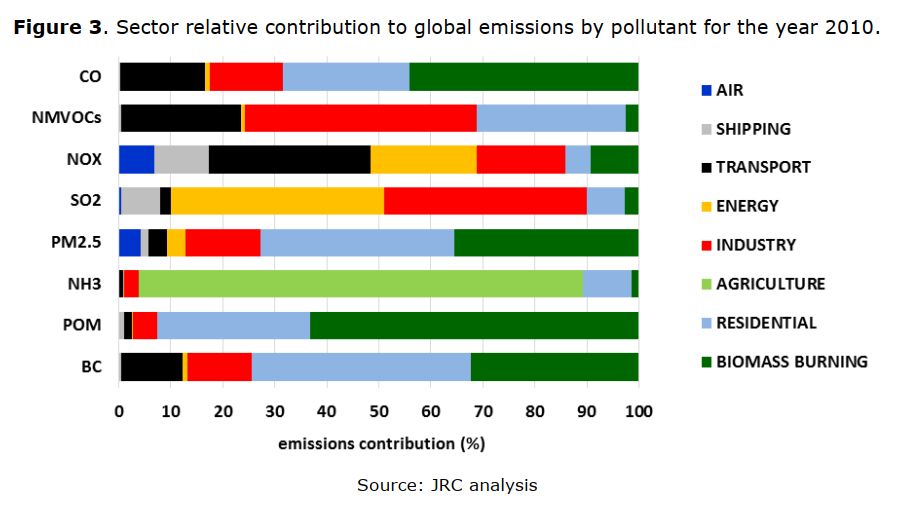
As seen in the graphs below, taken from a global modeling study, the main sources of PM2.5 are industry, power generation, transport, agriculture, residential fuel use and forest fires, with differing shares across regions. For NOx, transport, industry and power generation dominates. The key solutions are stronger emissions standards for those sectors, and eliminating or significantly reducing the burning of fossil fuels and biomass.


With the COVID-19 pandemic, another public health issue has emerged: the risk of death from COVID-19 is substantially higher for people living in more polluted areas. In this way, air pollution is contributing to the pandemic. Globally, approximately 15% of deaths from COVID-19 are linked to PM2.5 air pollution. The authors estimate that average PM2.5 concentrations above 3.6 µg/m3 (range: 0.0–6.7) increase the risk of death for COVID-19 patients, also underscoring the need to strengthen the guideline.
In many countries, current air pollutant levels are far above the WHO guidelines. However, our analysis shows that even if all countries met the guidelines, air pollution would still be responsible for around 7 million deaths every year. In some countries, such as the United States and the United Kingdom, only 1% of air pollution-related deaths would be eliminated by meeting the current guidelines.
The tools below let you look at the current health impacts of air pollution in different countries, the health impacts that could be avoided if those countries met their national air quality standards or the WHO guidelines, and compare the national standards to the guidelines. The health impacts are assessed following the methodology of the CREA publication “Quantifying the Economic Costs of Air Pollution from Fossil Fuels”.
Tracking Ambient Air Quality Standards
We developed a tool visualizing where country’s national ambient air quality standards compared with the WHO’s. You can access the tracker on Tableau Public.
Disclaimer: The designations employed and the presentation of the material on the map do not imply the expression of any opinion whatsoever concerning the legal status of any country, territory, city or area or of its authorities, or concerning the delimitation of its frontiers or boundaries.
Health Impacts under WHO Guidelines: A Case for Better Air Quality
We developed a tool to assess the health impact of various existing or potential guidelines, in most countries worldwide. You can access it here: https://crea.shinyapps.io/whoimpact/
We are constantly updating these tools and our data. If you’re interested in countries not yet included here, see out of date information, or have ideas to use this to drive change, we would love to hear from you.
Contact: getintouch@energyandcleanair.org
Resources: Interactive Country tracker || Health Impact Assessment of Air Quality Guidelines


