Measurement report: A multi-year study on the impacts of Chinese New Year celebrations on air quality in Beijing, China
Higher atmospheric concentrations due to elevated pollutant emissions during
the Chinese New Year were observed at both BUCT-AHL and the MEP sites during
the analysis periods. The observed features include sudden spikes in
concentrations of trace gases, aerosol particles, and BC. These observations
agree with the previous studies showing a connection between holiday-related
firework celebrations and degraded air quality (Jiang et al., 2015; Yang et
al., 2014; Shi et al., 2014; Feng et al., 2012; Zhang et al., 2010). In the
sections below, we delve into these results, which can broaden
scientific understanding of the impacts of firework celebrations on local
and regional air quality, especially in the context of a wide metropolitan
area over the course of several years.
3.1
Characteristics of air quality during the Chinese New Years 2018 and 2019
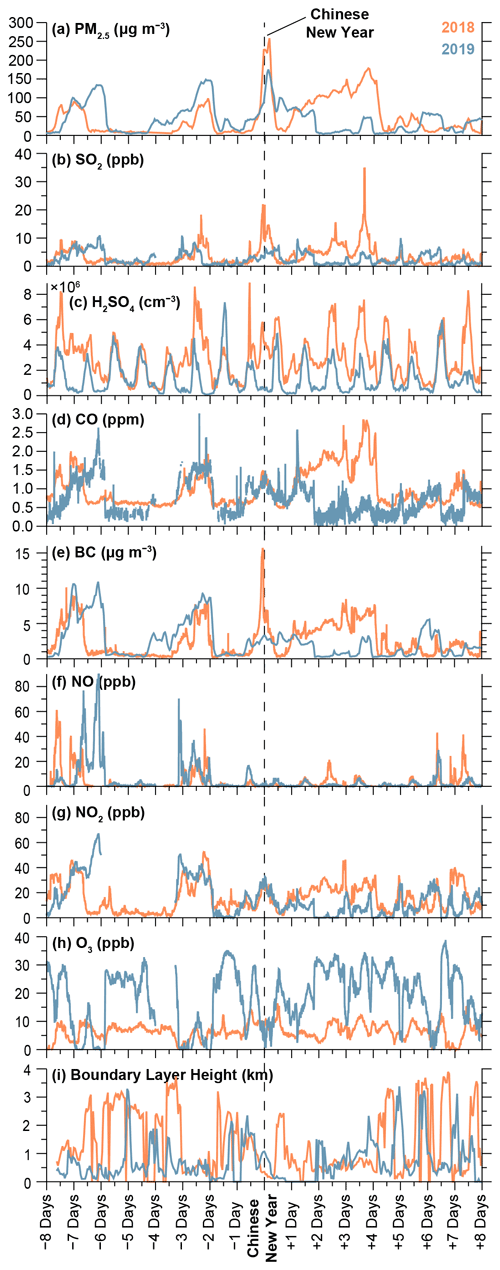
The CNY was on 16 February 2018 and 5 February 2019. Figure 2 shows a
time series of air pollutant concentrations from 8 d before to 8 d after the 2018 and 2019 CNY at BUCT-AHL (except for PM2.5, which
is from the nearby MEP sites). We observed sharp peaks in particulate matter
mass (PM2.5), SO2, sulfuric acid, CO, BC, NO, and NO2 and
ozone during firework events. In 2018 the peak in PM2.5 was over 250 µg m−3, compared to less than 50 µg m−3 half a day
before, and in 2019 the peak of PM2.5 was over 150 µg m−3
compared to less than 100 µg m−3 earlier in the day. Similar
spikes in BC, gas-phase sulfuric acid, and trace gas concentrations of
several times the values earlier in the day were observed in 2018 as well.
Download
In contrast, in 2019, PM2.5 was observed to have less noticeable
enhancement in concentration. While there was a noticeable spike in SO2
overnight of the CNY in 2018 (a spike over 20 ppb compared to less than 5 ppb earlier in the day), shown in Fig. 2, a much less noticeable
enhancement of SO2 was observed overnight of the 2019 CNY (a peak
around 5 ppb compared to around 3 ppb earlier in the day).
The measurements showed elevated nighttime concentration of H2SO4
on CNY in 2018 exceeding 3×106 cm−3 during the whole
night, which was an order of magnitude higher than typical nighttime
H2SO4 concentrations of 5×105 cm−3 (Dada et
al., 2020). In 2019, there was no evident indication of anomalies in
nighttime H2SO4 concentration during CNY. An unknown spike in
H2SO4 was noticed at noon the day before CNY in 2018, and its
association with celebratory activities is unclear. Like with PM2.5 and
SO2, Fig. 2 shows a distinctive spike in BC around midnight of the
2018 CNY. Although SO2 and BC also originate from coal combustion and
other emission sources (Wang et al., 2018), because of the shortness of the
peak and the fact that it occurs at exactly midnight, these simultaneous
peaks of BC and SO2 during the nighttime of CNY most likely originate
from firework burning.
However, there appeared to be little to no effect of CNY on BC in 2019. The
measurements showed an elevated concentration of NO2 overnight of the
CNY in both years (45 ppb in 2018 and 20 ppb in 2019), yet no obvious spike
in NO concentration. A high NO2/NOx ratio can be caused by
accumulation of pollutants emitted the previous afternoon (Chou et al.,
2009), but in the case of CNY night it is straightforward to conclude that it is due
to firework burning, which has been shown to emit NO2 but no NO (Jiang
et al., 2015).
Figure 2 also shows that during the CNY celebrations in 2018 concentrations
of the primary pollutants, SO2, CO, BC, NO, and NO2, were elevated,
implying enhanced direct emissions during the CNY period. Secondary
pollutants are formed through chemical reactions (Seinfeld and Pandis, 2016)
including, for instance, sulfuric acid and ozone. The concentrations of
these secondary pollutants were as expected: sulfuric acid concentration
increased due to enhanced formation rate with increased SO2
concentration, and ozone concentration decreased with increased chemical
sink by NOx and CO (and probably other carbon compounds). However, in
2019, only the concentrations of CO and NO2 were observed to increase
during CNY celebrations, leading to a decrease in ozone concentration.
Interestingly, in addition to the short-term enhancement of pollutant
concentrations, Fig. 2 shows degraded air quality between 16–20 February 2018, following the Chinese New Year, which closely resembles the
characteristics of a haze event as described in Zhao et al. (2013, 2011) and Zhang et al. (2020). Using the data from BUCT-AHL, this period
was quantifiably classified as a haze event using the algorithm in Zhou et
al. (2020). These haze events have elevated concentrations of pollution
continuously for multiple days, and concentrations gradually increase
throughout the episodes. The haze eventually ends with sudden decline, often
caused by an arrival of a cold front or change in synoptic weather
conditions. Several previous studies, including Jiang et al. (2015) and Li
et al. (2013), suggest that fireworks likely contribute to haze formation.
It is plausible that the increased level of pollutants observed overnight
during the 2018 CNY likely contributed to this subsequent haze period.
However, the meteorological conditions and air mass origins are also
important for haze formation and are discussed in Sect. 3.2.
3.2
Effects of meteorology and boundary layer height
Because the meteorological conditions during CNY vary between different
years, it is important to address the impact of local- and synoptic-scale
meteorological parameters on air pollution when comparing different years to
each other. Specifically, wind speed and direction, relative humidity (RH),
boundary layer height, and precipitation can affect pollutant concentrations
during and after the fireworks.
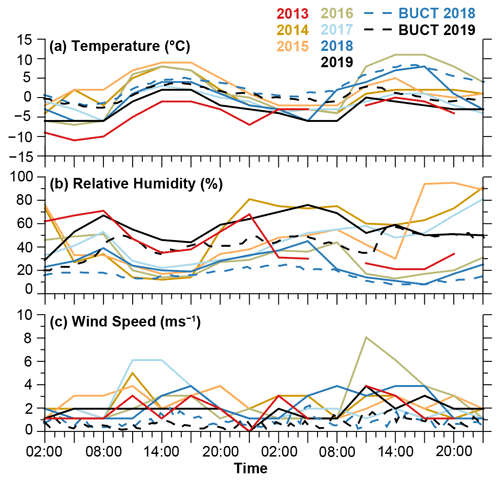
However, none of the measured local meteorological variables showed drastic
differences between CNY nights of 2018 and 2019. The wind speed during the
night of the 2018 CNY peaked at ∼ 2 m s−1, and during the night
of the 2019 CNY, it remained to values less than ∼ 1 m s−1
(Figs. 3 and S1 in the Supplement). Temperature was between 0 and 5 ∘C in both years. Some difference was observed in relative
humidity as CNY 2018 took place in very dry conditions (RH ∼ 20 %), whereas during CNY 2019 RH was roughly 40 %. Precipitation was
not measured at BUCT-AHL in either year, and weather data measured at ZBNY
show there was no precipitation in the region during either of the years
(data obtained from Weather Underground), which was supported by observed RH
values below 50 %. The nocturnal boundary layer heights were less than 500 m in both years (Fig. 2), which is unfavorable for vertical mixing of
the pollutants. Due to the slightly lower wind speeds in 2019 than 2018, we
would expect more efficient dispersion of pollutants and thus lower
concentrations in 2018. Higher RH is also often related to higher
concentrations of aerosol pollutants (Sun et al., 2013). However, what we
observed was that there were higher concentrations in 2018 than 2019. This
indicates that the reason for lower pollutant concentrations in 2019 is not
differences in the local meteorological conditions.
Download
The lower concentrations observed during the emission spike in 2019 can be
either due to lower emission rates in the area with which the measured air
mass is in contact or due to a shorter exposure to roughly similar
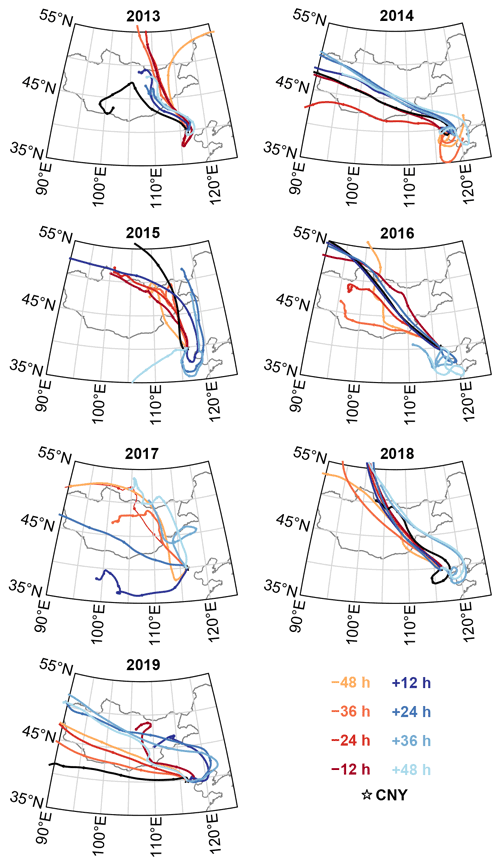
emissions during both years. Figure 4 shows 96 h back trajectories by
HYSPLIT, during the night of CNY in 2018 and 2019, showing the sources of
the air masses. This provides further insights into the history of the
air masses in Beijing, including how clean we can expect the air masses to be
before CNY and whether the air masses are stagnant around Beijing or whether
clean air is being transported into the city.
These trajectories show the following: in 2018, the air masses from 6 h
prior to CNY through CNY are from the southwest, and from 2 through 6 h after CNY, the air mass is from the west. In 2019, air masses from 6 h prior to CNY through 2 h prior to CNY are from the
east, and following the CNY the air masses are primarily from the west.
Based on Wang et al. (2019), air masses from the east are expected to be
cleaner than from the southwest due to more diffusion and fewer emissions
from industry. However, we observed the opposite: from 6 through 2 h
prior to midnight (i.e., the background value before the spike in pollution),
the background pollutant concentrations are higher in 2019 than in 2018.
This gives further indication that the emission sources are likely localized
and short-term as opposed to long-range transport.
3.3
Aerosol particle number concentrations and aerosol number size distribution
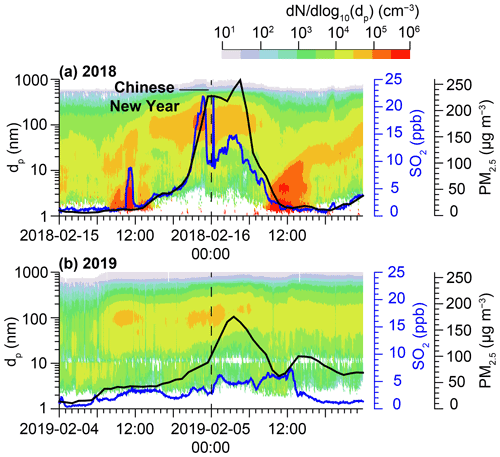
Further exploring the effects of the fireworks on air pollution, Fig. 5
shows PSD at BUCT-AHL from the day before to the day after CNY. Shortly
before midnight on CNY in 2018, an elevated concentration of aerosol
particles with diameters of roughly 100 nm was observed, simultaneously with the
spike in SO2 concentration. After the spike, SO2 concentration
remained elevated until the next morning. PM2.5 concentration increases
simultaneously with the SO2 concentration but did not show the same
spike as SO2. PM2.5 concentration remained high (>200 µg m−3) until the next morning, when it decreased to low values
(<30 µg m−3) together with decreasing SO2
concentration. The nocturnal pollution episode showed a very similar pattern
in both SO2 and PM2.5, despite the spike in SO2 occurring
together with increased number concentration of roughly 100 nm particles and
BC (Fig. 2e). This is consistent with air pollution from firework burning.
It might have originated from a source nearby, but it can also be
transported as a single strong plume from further away, e.g., from outside
the 5th Ring Road, which was the edge of the prohibited area for
firework activity. The overnight elevated concentration of PM2.5 and
SO2, excluding the SO2 spike, may be related to an accumulated
mixture of firework- and other festivity-related emissions, e.g., from
traffic or cooking. The accumulation of PM2.5 seems to be related to
secondary aerosol formation since the particle size distribution shows
growth of particles in the dominant particle mode during the CNY night
(concentration dN/d(log(dP )) over 3.3×104 cm−3 between
diameters 40 and 200 nm at around 20:00 and between diameters 60 and close to
300 nm at around 04:00).
Download
In 2019, secondary aerosol mass formation was also observed as the particle
mode grew in diameter steadily between 18:00 and 06:00, and the PM2.5
concentration increased simultaneously until 04:00. The peak PM2.5
concentration was, however, much lower in 2019 than in 2018 (roughly 100 and close to 250 µm m−3, respectively).
SO2 increased steadily throughout the night and exhibited only a mild
peak, from 3 to 6 ppb, shortly after midnight. This peak was again
accompanied by a simultaneous increase in concentration of particles with
diameters around 100 nm and in BC concentration (Fig. 2), which suggests
a contribution from fireworks. However, since the SO2 concentration
showed only a mild peak and did not follow the PM2.5 concentration, the
contribution of nearby firework activity to the overall pollution was
estimated to be negligible.
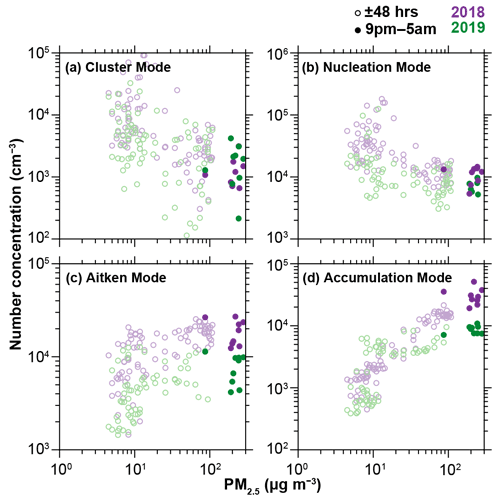
Figure 6 shows the particle number concentrations in four size modes,
specifically sub-3 nm cluster mode, 3–25 nm nucleation mode, 25–100 nm
Aitken mode, and 100–1000 nm accumulation mode, as a function of PM2.5
concentration measured at BUCT-AHL in 2018 and 2019. This figure starts 48 h before CNY and runs through 48 h after the CNY. The filled circles
mark the nighttime measurements on the CNY (21:00–05:00). The nighttime mass
concentrations are noticeably greater. The mass-to-number concentration
comparison for CNY follows the same general curve during nighttime as the
full time period. The pattern, particularly the nighttime observations, is
consistent with recent investigation by Zhou et al. (2020), which showed
that in general concentrations of pollutants are higher during nighttime,
attributed to a lower boundary layer and consequent high concentrations
within the boundary layer. As noted in Sect. 3.1, the PM2.5
concentrations during the CNY period in 2018 were nearly an order of
magnitude higher than before and after this time. The elevated PM2.5
concentration is directly connected to the elevated number concentration of
accumulation-mode particles (Fig. 6, bottom right panel), and the CNY data
points do not diverge from the overall coupling. This indicates that the
typical sizes of particles contributing to PM2.5 remain similar during CNY
compared to before and after it. Since the accumulation-mode particle
concentrations form the main part of the total particle surface acting as a
condensation sink for vapors forming new particles in the atmosphere and a
coagulation sink for small cluster- and nucleation-mode particles, it is
natural that the concentrations of cluster and nucleation mode decrease with
increasing PM2.5 (Fig. 6, upper panels).
Download
In short, the CNY activities seem to not cause any major deviance for the
typical aerosol dynamics other than the enhancement of the source of
accumulation-mode particles.
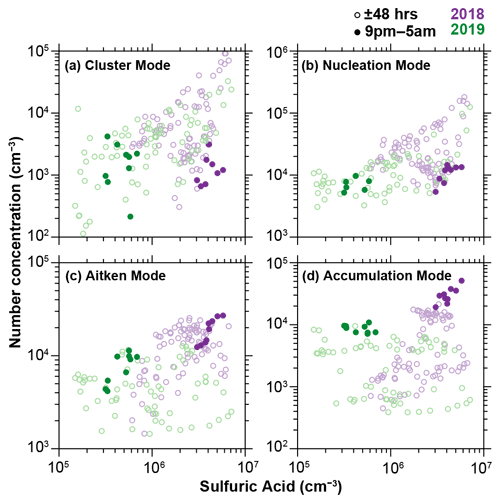
Figure 7 depicts the cluster-, nucleation-, Aitken-, and accumulation-mode
particle number concentrations as a function of gas-phase sulfuric acid
concentration in 2018 and in 2019 inside and outside of the CNY period.
Looking at the clusters, the results show a general strong dependency on the
sulfuric acid as it is one of the main precursors driving the process of
gas-to-particle conversion (e.g, Sipilä et al., 2010; Kulmala et al., 2013; Yao et al., 2018). However, the high nocturnal sulfuric acid
concentration during CNY celebrations in 2018 does not lead to high cluster-
or nucleation-mode concentration. In fact, the particle number
concentrations in these modes deviate from the otherwise clear response to
sulfuric acid concentrations. The reason for this is visible in the panel
for accumulation-mode concentration vs. sulfuric acid concentration: during
the CNY 2018 the high concentrations of accumulation-mode particles
correlate with sulfuric acid concentration, thus plausibly neglecting the
enhanced particle cluster and particle formation rates by an enhanced
coagulation sink as explained earlier.
Download
3.4
Multi-year variation in Chinese New Year effects in Beijing
Fireworks were formally prohibited within the 5th Ring Road of Beijing
beginning in 2018, whereas outside the 5th Ring Road, there were no
prohibitions (Liu et al., 2019). Still, there was some evidence of firework
burning observed at BUCT-AHL, which is within the prohibition area.
A longer-term multi-year study can be useful in demonstrating whether or not
the policy is effective in reducing firework-related pollution and if there
is an overall decreasing trend of pollution effects from fireworks over
multiple years. To investigate this question, it is useful to compare the
2018 and 2019 CNY with previous years in Beijing. Datasets have been
analyzed from 12 MEP stations in the Beijing area from 2013 through 2019.
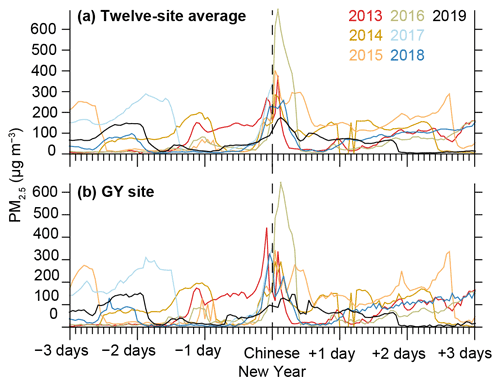
Figure 8 shows that each year, there was a spike in pollution around
midnight during the CNY. The highest levels were observed in 2016, with the
peak in PM2.5 around midnight of the CNY reaching almost 700 µg cm−3, while values earlier in the day were less than 100 µg cm−3. The lowest levels of PM2.5 were in 2019, with the overnight
peak less than 200 µg cm−3 compared to daytime values around 50 µg cm−3. Observations from 2013, 2014, 2015, and 2017 also showed
similarly high or higher levels of PM2.5 as in 2018 (unfortunately the
2017 dataset is incomplete and does not extend beyond 00:00 of New Year’s Day
due to a network outage). The measurements for all 7 years are in
agreement with other studies that have linked elevated air pollution levels
to CNY celebrations (Yang et al., 2014; Shi et al., 2014; Feng et al., 2012;
Zhang et al., 2010), and this study further shows that the peak in 2019 is
lower than in 2018, which is lower than in 2016 and 2017.
Download
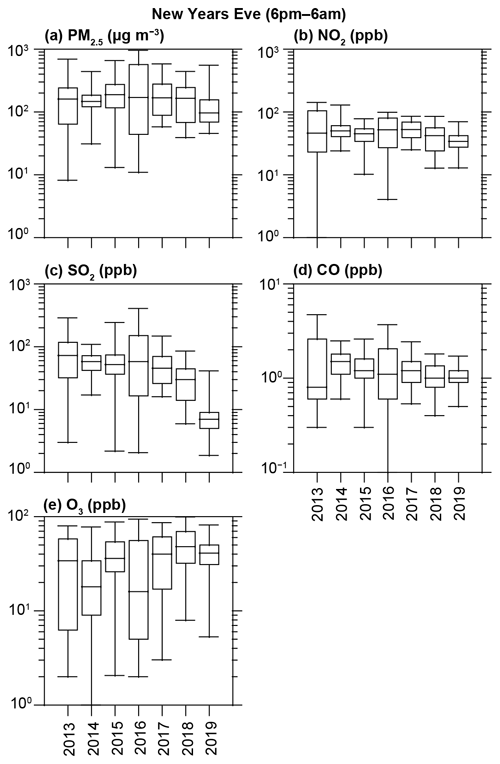
Data from the CNYs have also been compiled into box plots in Fig. 9,
depicting the distributions of pollutant concentrations from 18:00 on CNY
Eve to 06:00 on the CNY day each year at all 12 MEP stations. The highest
PM concentrations during this time were in 2016, and the 75th and
99th percentile concentrations have decreased after that. On the other
hand, the median concentration remained high during 2017 and 2018 but
decreased in 2019 by roughly a factor of 2. Concentrations of NO2 and
SO2 show a more steady decrease than PM2.5 since the median
concentration of both pollutants decreased steadily from 2016 (regarding
NO2 for 2017), but for CO there is no clear pattern. It should be noted
that in 2017, the data are missing after midnight due to an unknown network
outage. The more noticeable decrease in NO2 and SO2 is an expected
outcome for a ban on firework burning since both are produced by fireworks
and have shorter lifetimes than CO and PM2.5 (Seinfeld and Pandis,
2016; Lee et al., 2011). Thus, they are less affected by long-range
transport and accumulation. The decrease in pollutant concentrations since
2016 agrees with the results obtained by Liu et al. (2019). Since ozone is a
secondary product, and it reacts with several primary pollutants, its
concentration pattern being roughly opposite to those of primary pollutants
is as expected.
Download
Based on HYSPLIT back trajectories (Fig. 4), we see that in 2013–2015 the
air masses spent more time in the BTH area prior to arrival. This differs from
the air mass sources in 2016–2017, where the air masses come directly from the
northwest. These areas to the northwest of Beijing, including Inner Mongolia
and Mongolia, usually contain fewer pollutants due to low anthropogenic
emissions, and thus we can expect air masses from this region to be cleaner
(Xu et al., 2008). Based on the air mass history, if emissions were the same,
then there should be higher concentrations in 2013–2015; however, we see the
highest concentrations of pollutants in 2016, followed by a decline after
that. In 2018 and 2019, the air masses spent around 2 d in the BTH area
leading up to arrival at the station. Based on air mass source alone, we
would have expected higher pollutant concentrations in 2018 and 2019, but
this is not the case. Thus, we can conclude that emissions must have been
highest in 2016, with lower emissions in 2018 and 2019. This agrees with Liu
et al. (2019).
3.5
Spatial variability based on MEP measurement network data
Next, we performed a spatial comparison of the MEP measurements across the
Beijing region. This includes comparing the observations inside the 5th
Ring Road, where fireworks were prohibited, to outside the ring. Figure 10
maps the 12 MEP stations in the Beijing region for 2013–2019, showing the
ratio between mean PM2.5 concentration from 21:00 through 05:00 during
the night of CNY and the mean concentration within ±48 h of the
CNY at each site. Figures S2–S13 show
observations of PM2.5 from the 12 individual MEP sites and the
corresponding differences year by year from 2013–2019. Based on Fig. 10,
we can see significant variation from year to year as to which station
measures the highest pollution. It is important to note that the population
density is greater closer to the city center, and thus the population density
could impact the results. However, it is plausible to assume that the
relative population density difference between the city center and the
surrounding areas does not change dramatically during the few years’ time
period.
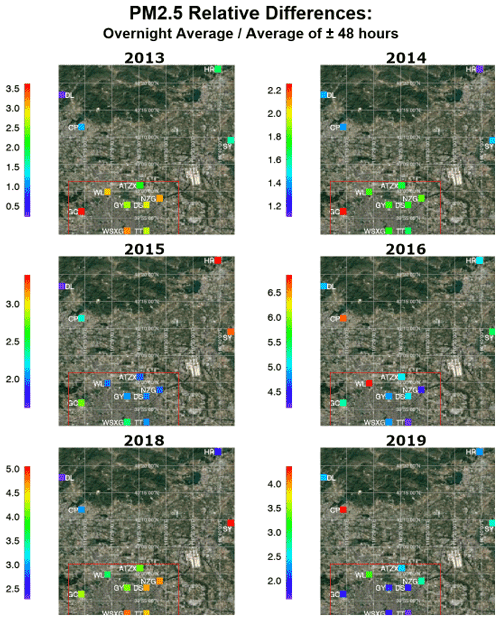
Figure 10 illustrates that in 2013 and 2014, the enhancement in PM2.5
concentrations during CNY is greater inside the 5th Ring than outside.
In 2015, the enhancement is much greater at the two northeastern sites (HR: Huairou; SY: Shunyi). In 2016, the differences vary, with no clear difference inside or
outside the 5th Ring. In 2018, the enhancement of PM2.5 is higher
inside the 5th Ring than outside, except for the SY site to the far
northeast, which had significantly high enhancement compared to the other
sites. In 2019 the enhancement is overall less inside compared to outside.
The enhancement factors outside the 5th Ring Road (excluding the single
highest value) and at the northern inside stations nearest to the Ring Road
are quite similar in 2019, roughly in the range of 2.5 to 3, but the peak times of
pollution are a few hours earlier at the outside stations than the northern
inside stations (Fig. S12). The measurement sites closer to central Beijing,
on the other hand, show clearly lower enhancement factors of values of 2
or below. Based on these spatial and temporal differences and on the
northerly winds observed at the time, it is possible that the higher
enhancement factors inside but close to the 5th Ring Road are related
to emissions from outside the Ring Road.
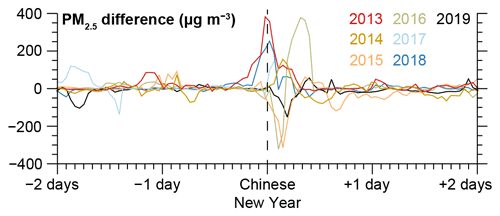
Figure 11 shows differences between the PM2.5 mean of the sites inside
the 5th Ring Road and the mean of the sites outside the 5th Ring
(that is the mean of the eight inside sites minus the mean of the outside four
stations) 48 h before through 48 h after the CNY for 2013–2019. In
2013, 2014, and 2018, the enhancement of PM2.5 during the CNY overnight
is greater inside than outside the 5th Ring Road. However, in 2015 and
2019, as well as immediately after the CNY midnight in 2016, PM2.5 was
lower inside than outside. While we were lacking the detailed data on local
meteorology during 2013–2016, we were still able to analyze the
meteorological conditions in terms of air mass trajectories. Figure 4 shows
that, similar to 2019, as discussed previously, in 2015 and CNY midnight of
2016, air masses arriving in Beijing were from the cleaner northwestern sector
and arrived with much higher velocity in comparison to the years 2013, 2014, and
2018, during which the air masses made a turn to the south or east before
arrival in Beijing. Even though the CNYs during which the increase in PM2.5
enhancement inside the 5th Ring Road is less pronounced than outside
seem to be related to faster arrival of cleaner air masses, we have no clear
view for the reason of this difference, and, due to the qualitative nature of
this comparison, it is well possible that this connection is pure
coincidence. The similarity of the years 2015 and 2019 in terms of the spatial
variation in CNY midnight pollution peak suggests that meteorology may be at
least part of the reason for the lesser enhancement of pollution levels
inside the 5th Ring Road than outside. Nevertheless, the notably lower
concentrations of PM2.5 and gaseous air pollutants in 2019 than in 2015
indicate that, even with similarities in spatial distribution of changes in
concentrations, the most likely reason for lower concentrations during CNY
night is the lower emissions.
Download


